Austin Housing Market Report – August 2023
Presented by Smart Austin Realty Group
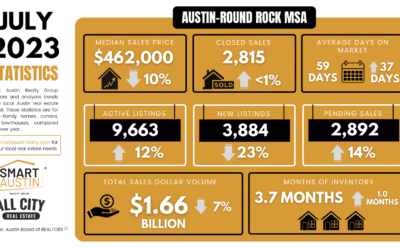
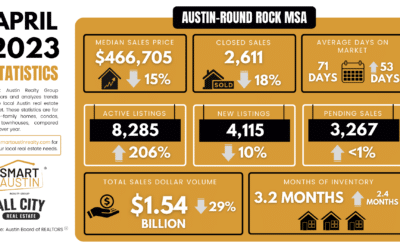
As we approach the close of summer, the Austin-Round Rock housing market presents a mix of shifting trends. In this report, we analyze key metrics, explore top-performing ZIP codes, and breakdown property type sales for August 2023. Our comprehensive review culminates in a comparative year-over-year and month-over-month analysis, providing essential insights for prospective buyers, sellers, investors, and homeowners.
- Closed Sales: A total of 3,021 properties were sold this month.
- New Listings: The market welcomed 4,228 new listings.
- Average Property Price: A typical property was priced at about $568,800.
- Months of Inventory: Inventory levels averaged around 2.3 months.
- Days on Market: On average, properties took 28 days to finalize their sales.
- Price Per Square Foot: This stood at about $287, indicating the price buyers pay per square foot of property space.
- Sales Leaders: ZIP codes 78641 (161 sales), 78628 (139 sales), and 78660 (134 sales) emerged as the sales front runners.
- Premium Pricing Areas: ZIP codes 78746 ($2,179,744), 78735 ($1,645,281), and 78703 ($1,607,509) commanded the loftiest average property prices.
- Single Family Homes: Leading the charge with 2,747 sales, their average price stood at $579,415.
- Condominiums: Recorded 232 sales with a mean price of about $463,693.
- Townhouses: 42 townhouses were sold at an average price of approximately $455,152.
- Closed sales and new listings experienced declines of 4.37% and 4.80%, respectively.
- The average property price decreased by 5.31%.
- Notably, the months of inventory soared by 82.37%.
- Days on market saw a significant uptick of 93.50%.
- Price per square foot reduced by 6.72%.
- Closed sales and new listings demonstrated positive growth with increases of 2.55% and 5.38% respectively.
- A slight dip in average property price by 0.88% was observed.
- Months of inventory witnessed a 27.28% growth.
- Days on market edged higher by 1.25%.
- Price per square foot slid down marginally by 0.30%.

City of Austin – August 2023
- 858 – Residential homes sold, 1.3% less than August 2022.
- $541,000 – Median price for residential homes, 0.7% less than August 2022.
- 1,191 – New home listings on the market, 1.9% more than August 2022.
- 2,879 – Active home listings on the market, 22.8% more than August 2022.
- 759 – Pending sales, 5.8% less than August 2022.
- 3.9 – Months of inventory, 1.5 months more than August 2022.
- $594,479,723 – Total dollar volume of homes sold, 3.4% less than August 2022.

Travis County – August 2023
- 1,355 – Residential homes sold, 1.6% less than August 2022.
- $534,500 – Median price for residential homes, 4.8% less than August 2022.
- 1,921 – New home listings on the market, 2.4% more than August 2022.
- 4,772 – Active home listings on the market, 17.7% more than August 2022.
- 1,205 – Pending sales, 4.1% less than August 2022.
- 4.1 – Months of inventory, 1.4 months more than August 2022.
- $941,065,528 – Total dollar volume of homes sold, 7.5% less than August 2022.
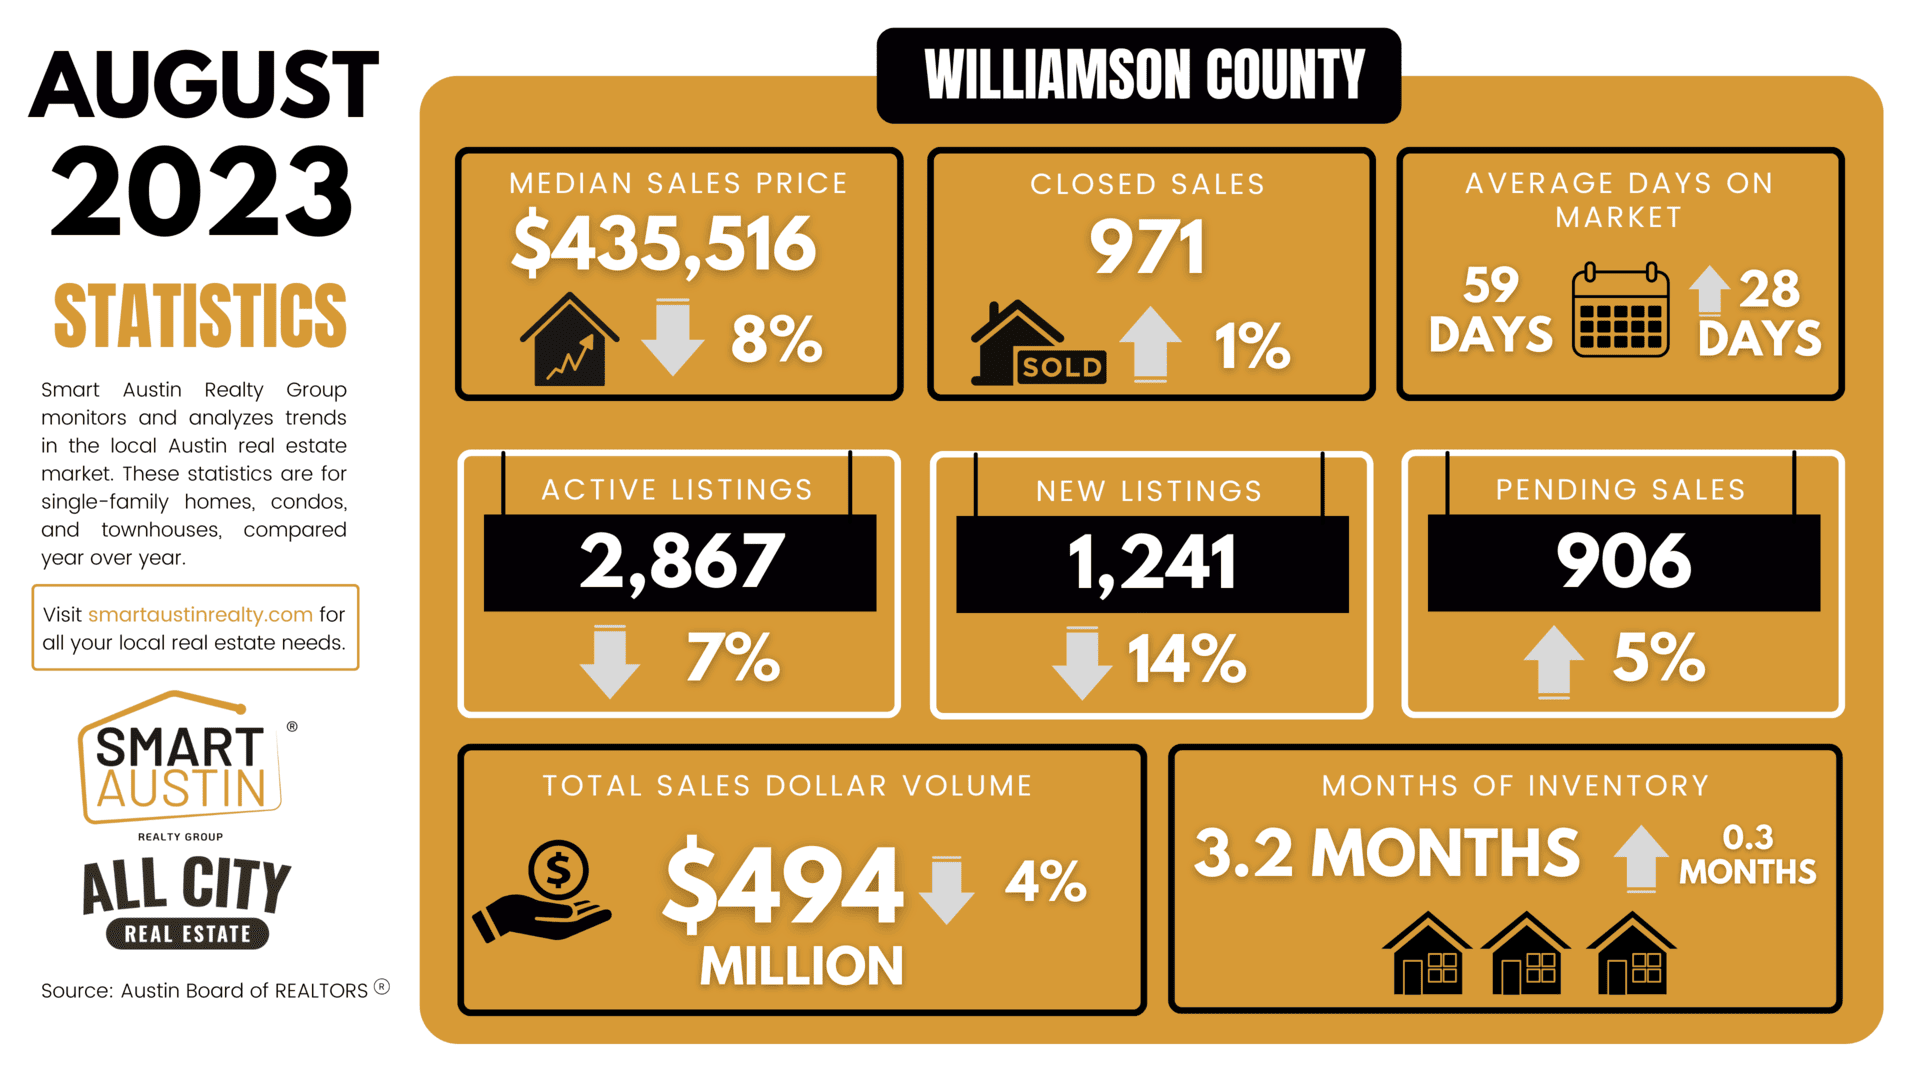
Williamson County – August 2023
- 971 – Residential homes sold, 1.7% more than August 2022.
- $435,516 – Median price for residential homes, 8.7% less than August 2022.
- 1,241 – New home listings on the market, 14.7% less than August 2022.
- 2,867 – Active home listings on the market, 7.9% less than August 2022.
- 906 – Pending sales, 5.7% more than August 2022.
- 3.2 – Months of inventory, 0.3 months more than August 2022.
- $494,684,214 – Total dollar volume of homes sold, 4.6% less than August 2022.
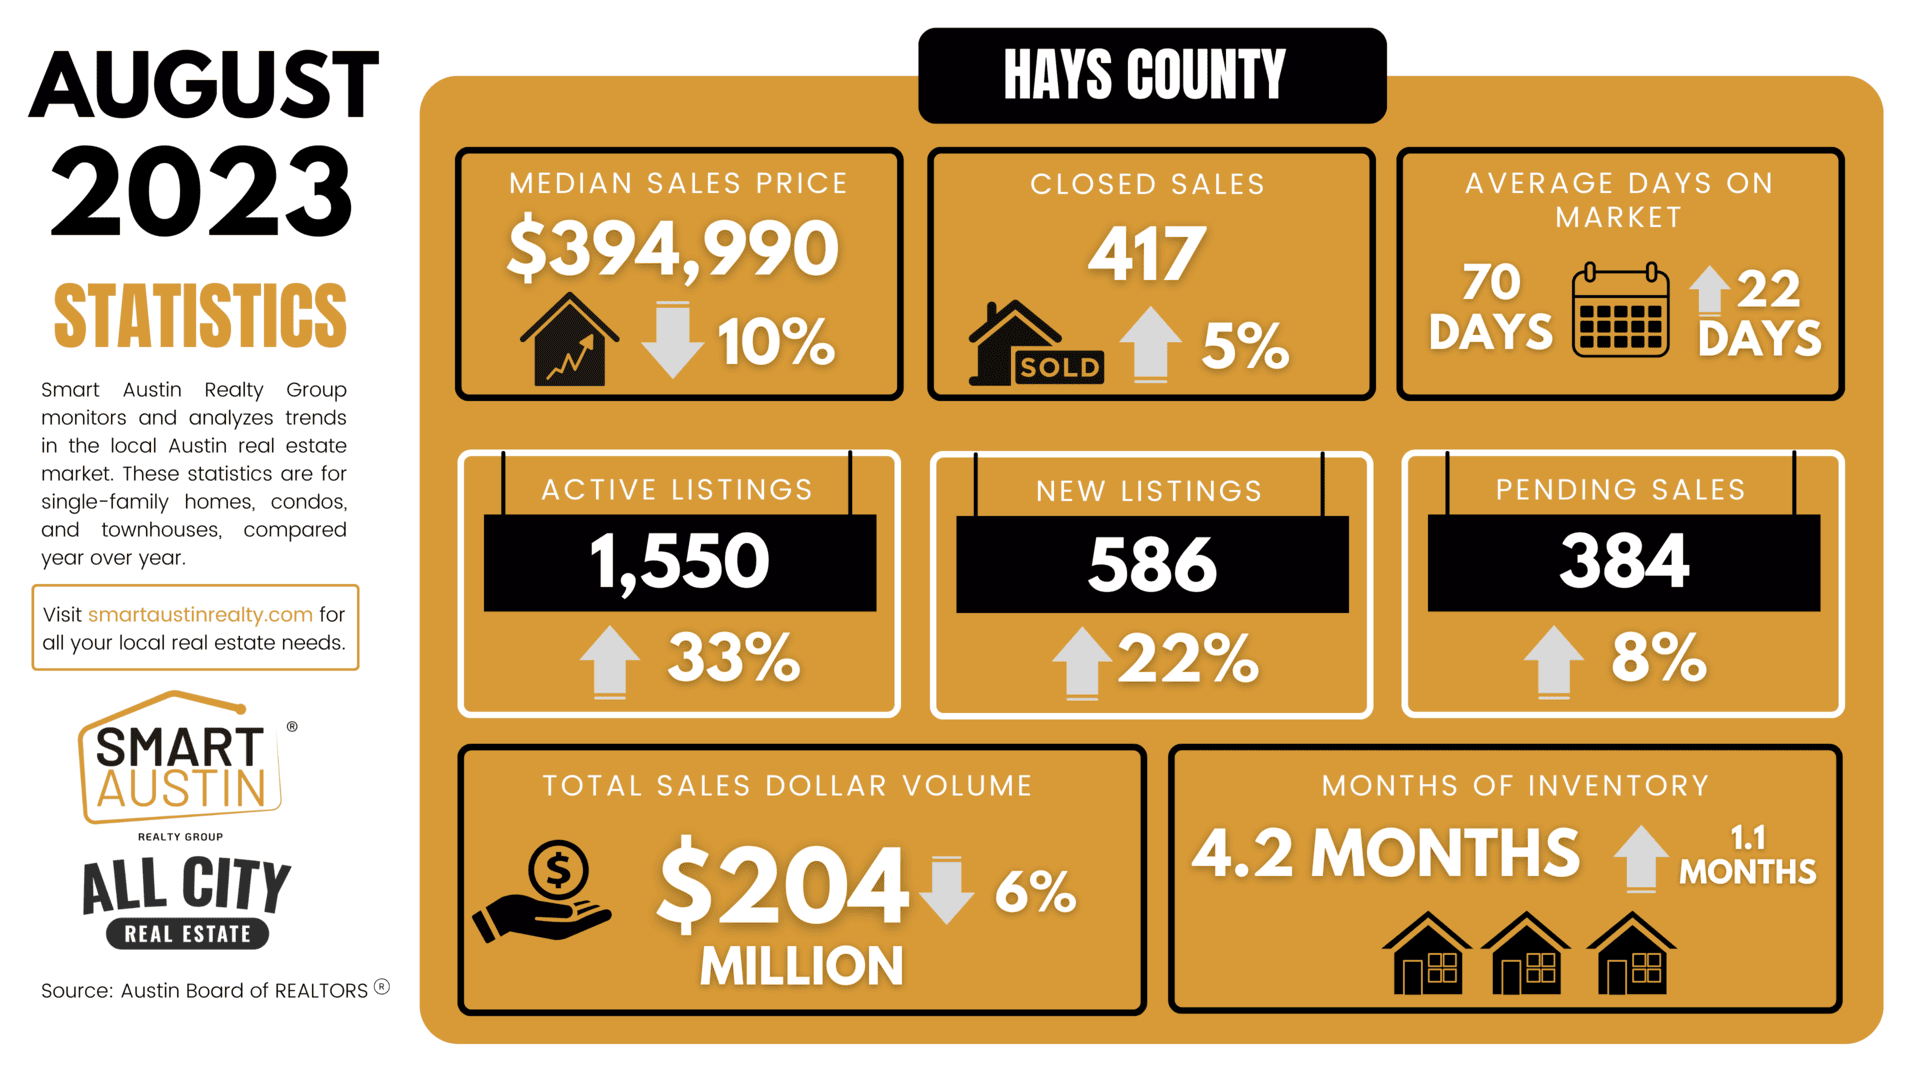
Hays County – August 2023
- 417 – Residential homes sold, 5.3% more than August 2022.
- $394,990 – Median price for residential homes, 10.1% less than August 2022.
- 586 – New home listings on the market, 22.3% more than August 2022.
- 1,550 – Active home listings on the market, 33.9% more than August 2022.
- 384 – Pending sales, 8.2% more than August 2022.
- 4.2 – Months of inventory, 1.1 months more than August 2022.
- $204,932,717 – Total dollar volume of homes sold, 6.0% less than August 2022.

Bastrop County – August 2023
- 154 – Residential homes sold, 29.4% more than August 2022.
- $339,990 – Median price for residential homes, 15.0% less than August 2022.
- 244 – New home listings on the market, 18.5% more than August 2022.
- 586 – Active home listings on the market, 28.0% more than August 2022.
- 146 – Pending sales, 19.7% more than August 2022.
- 4.8 – Months of inventory, 1.2 months more than August 2022 and the highest inventory in the MSA.
- $58,611,157 – Total dollar volume of homes sold, 15.4% more than August 2022.
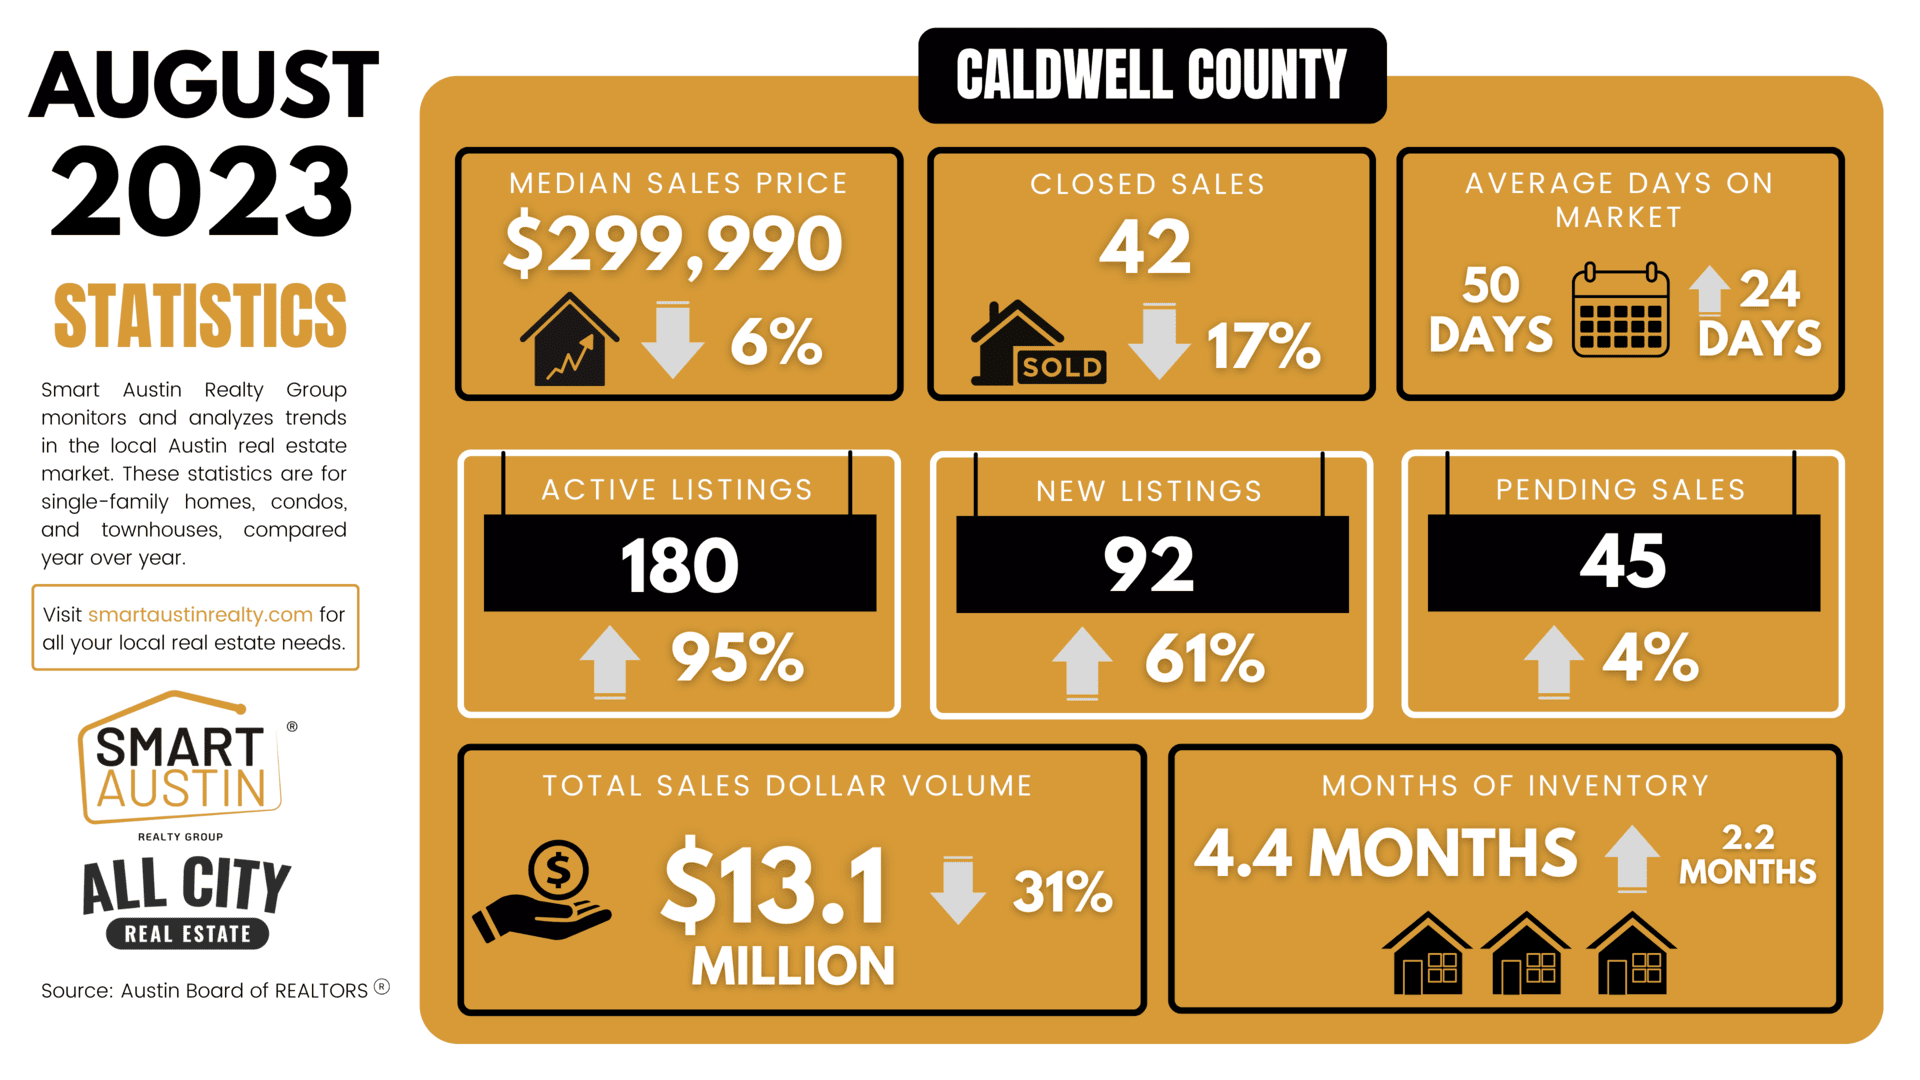
Caldwell County – August 2023
- 42 – Residential homes sold, 17.7% less than August 2022.
- $299,990 – Median price for residential homes, 6.9% less than August 2022.
- 92 – New home listings on the market, 61.4% more than August 2022.
- 180 – Active home listings on the market, 95.7% more than August 2022.
- 45 – Pending sales, 4.7% more than August 2022.
- 4.4 – Months of inventory, 2.2 months more than August 2022.
- $13,170,575 – Total dollar volume of homes sold, 31.2% less than August 2022.
Conclusion & Commentary:
August 2023 paints a picture of the Austin housing market undergoing subtle changes. Compared to August 2022, there’s a cooling trend, evidenced by reductions in closed sales, new listings, and average prices. However, the silver lining can be found in the month-over-month data, showcasing a surge in closed sales and new listings.
For buyers, it’s pivotal to note the gradual elongation in the days on market, implying that they might have slightly more negotiation power and choices. Sellers should stay alert to the burgeoning inventory, signaling a potential move towards a more balanced, less seller-dominated market.
Investors might see this as a dual-edged scenario. The growth in inventory could bring more choices, but the declining year-over-year prices might signify caution in terms of property value appreciation.
Lastly, homeowners should feel relatively assured. Despite some fluctuations, Austin’s property prices still stand resilient compared to many national averages.
However, a ubiquitous piece of advice remains – location is paramount. Whether you’re buying, selling, or investing, monitoring performance metrics specific to ZIP codes can lead to informed, strategic decisions.
Thank you for trusting Smart Austin Realty Group as your guide in navigating the ever-evolving Austin housing landscape. Stay tuned for more updates and insights.
Data-driven decisions lead to dream homes. Let Smart Austin Realty Group guide you.